The Real Numbers Behind the Pitch Decks
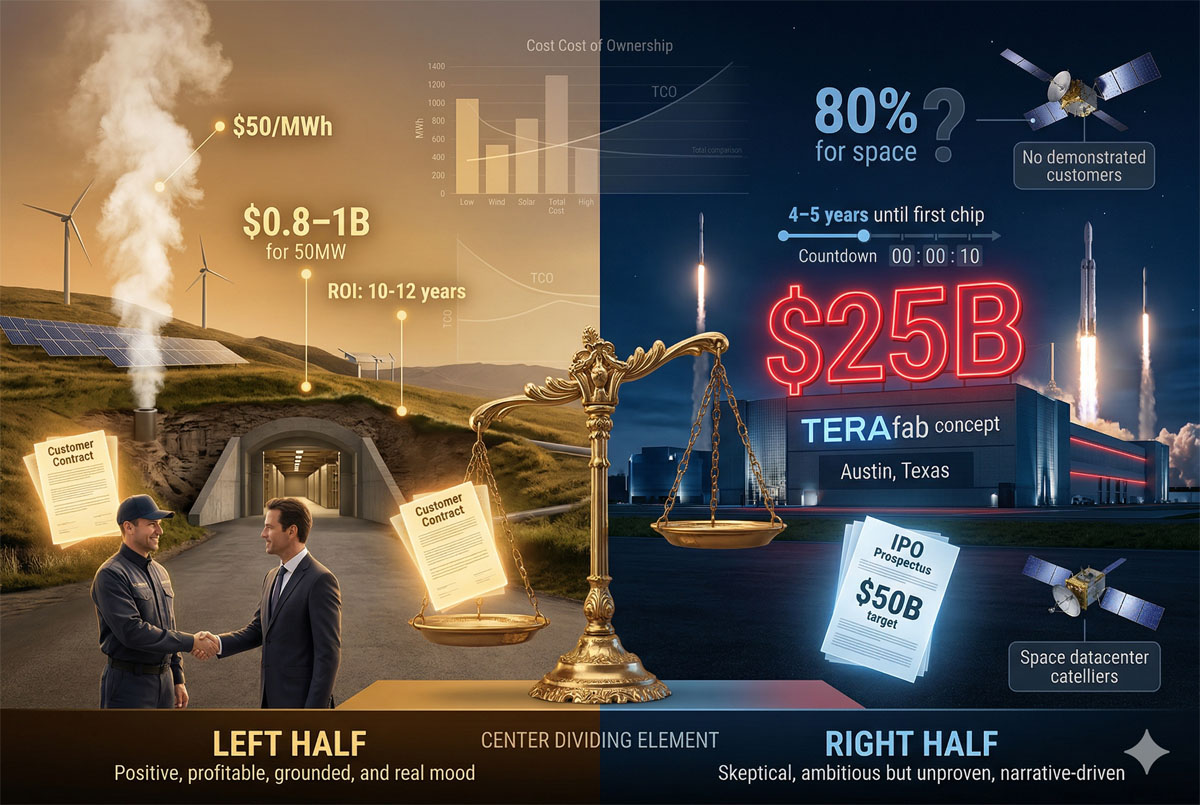
TERAfab announced $25B on March 22, 2026 — with no production timeline and no demonstrated customers. Let's compare the real numbers.
| Criterion | Underground Geothermal DC (50MW) | TERAfab + LEO Constellation |
|---|---|---|
| Initial investment | $0.8–1B (50 MW) | $20–25B (fab alone) |
| Energy cost | ~$50/MWh geothermal 24/7 | Solar orbital — cooling = vacuum radiators |
| Profitability horizon | 10–12 years (proven model) | Undefined — no market demonstration |
| Demonstrated customers | Yes — existing market | No — market to be created |
| Contractable SLA | 99.999% — insurable | Not insurable today |
| Refresh cycle cost | Standard rack replacement | New constellation launch every 18 months |
| IPO dependency | None | Central — SpaceX IPO $50B summer 2026 |
| Environmental impact | CO2-free + district heating | Stratospheric soot + debris accumulation |
The IPO sequence: TERAfab announced March 21, 2026 → SpaceX IPO targeting $50B announced for Summer 2026. The announcement precedes the proof. The IPO precedes the wafer. The narrative precedes the physics. A greenfield 2nm fab takes 4–5 years minimum under ideal conditions. Musk has zero semiconductor manufacturing background.
50 MW — 25-Year Total Cost of Ownership
$0.8–1B construction · $50/MWh energy · Standard maintenance · District heating revenue offset · Insurable SLA · 50-year facility life
TMR triples hardware cost · Refresh every 18 months = new launch · Kessler risk reserve unquantifiable · No insurable SLA · No maintenance possible
>60% landing failure rate · No operational energy source · Maintenance: $10–20B crew support · Regolith damage unmodelled · No SLA possible
EGS — The Numbers That Work
Enhanced Geothermal Systems are no longer experimental. Google, Meta, Fervo Energy and Bedrock Energy are in active deployment.
| EGS Parameter | Value | Source |
|---|---|---|
| Energy cost (grid-sited DC) | ~$75/MWh | Rhodium Group 2025 |
| Energy cost (geothermal-sited DC) | ~$50/MWh (-45%) | Rhodium Group 2025 |
| US hyperscale demand coverage by 2030 | Up to 64% | Rhodium Group 2025 |
| Iron Mountain Boyers PA | Operational · 60m underground · 35-acre water reservoir | DOE Better Buildings |
| Cooling as % of DC energy | 40% (target for reduction) | NREL 2025 |
| Cold UTES reduction potential | Significant peak load cut | DOE / NREL project |
The Perpetual Capital Destruction Model
The "fly-till-you-die" model transforms capex into permanent opex. A terrestrial datacenter amortises over 25 years. An orbital constellation rebuilds itself every 2–3 years — indefinitely.
| Cost Component | Terrestrial DC (1 GW) | Orbital Constellation (1 GW) |
|---|---|---|
| Initial hardware capex | ~$15–20B | >$50B (IEEE Spectrum estimate) |
| Refresh cycle | Modular rack swap: $2–5B/cycle | New constellation every 2–3 years |
| Annual GPU failure replacement | <1% — technician on-site | 9% estimated (90,000 units/yr in 1M sat fleet) |
| Memory supply chain | Commodity — global market, 8–39 wk lead | Boutique MRAM — 2–3 fabs, 12–24 month lead |
| Fuel depletion (avoidance) | Not applicable | 40K maneuvers/day shortens lifespan 30–50% |
| TCO over 10 years (1 GW) | $25–30B (proven, modelled) | Undefined — no public lifecycle model published |
| MoffettNathanson (100 GW) | N/A at this scale | $4–5 trillion capex estimate |
| Parity with terrestrial cost | Achieved today | Deutsche Bank: well after 2030 · Google: ~2035 |
The Starship math no one publishes: Musk's "basic math" — 1M tonnes of satellite per year for 100 GW — implies 25,000 Starship flights/year (aerospace engineer McCalip estimate). That is 68 launches per day. Every hour of every day. SpaceX's currently approved launch capacity: 69 flights/year total across Texas and Florida combined. The ratio is 362:1. Before this is an engineering challenge, it is a physical and regulatory impossibility at the stated timeline.
Construction: $0.8–1B. Energy: $50/MWh × 24/7 × 50 MW = ~$22M/yr. Maintenance: standard industrial. Hardware refresh: modular, on-site, ~$2–5B per 4-year cycle. District heating revenue offset. Total 25-year TCO (50 MW): $2–3B. Fully modelled. Proven at Iron Mountain scale.
Initial constellation: $50B+. Refresh every 2–3 years: new constellation cost each cycle. Fuel depletion from maneuvers: reduces lifespan. MRAM supply at scale: unpriced, supply chain non-existent. Kessler risk reserve: unquantifiable. GPU failure replacement (9%/yr): continuous launch cost. 25-year TCO: entirely undefined.